MokuGraph
Shipped the only AI architecture visualisation component on the Framer Marketplace
Field | Detail |
|---|---|
Product | MokuGraph |
Type | Framer Marketplace Component |
Scope | Product design, D3 engineering, interaction design, marketplace listing, repositioning |
Platform | Framer |
Framework | React + TypeScript + D3 (bundled) |
Marketplace |
Summary
Problem: No interactive AI architecture visualisation existed on the Framer Marketplace. The one available graph component was general-purpose and could not represent the complexity of real production systems.
Solution: MokuGraph, a force-directed graph component with 12 AI architecture templates, two interaction modes, and full property-panel customisation. Built with React, TypeScript, and D3.
Impact: Rejected on first submission across all four Framer Marketplace criteria. Rebuilt from scratch, repositioned from generic graph tool to AI Architecture Maps, and approved four weeks later. Now in production on the Mokujiro Studio website.
Overview
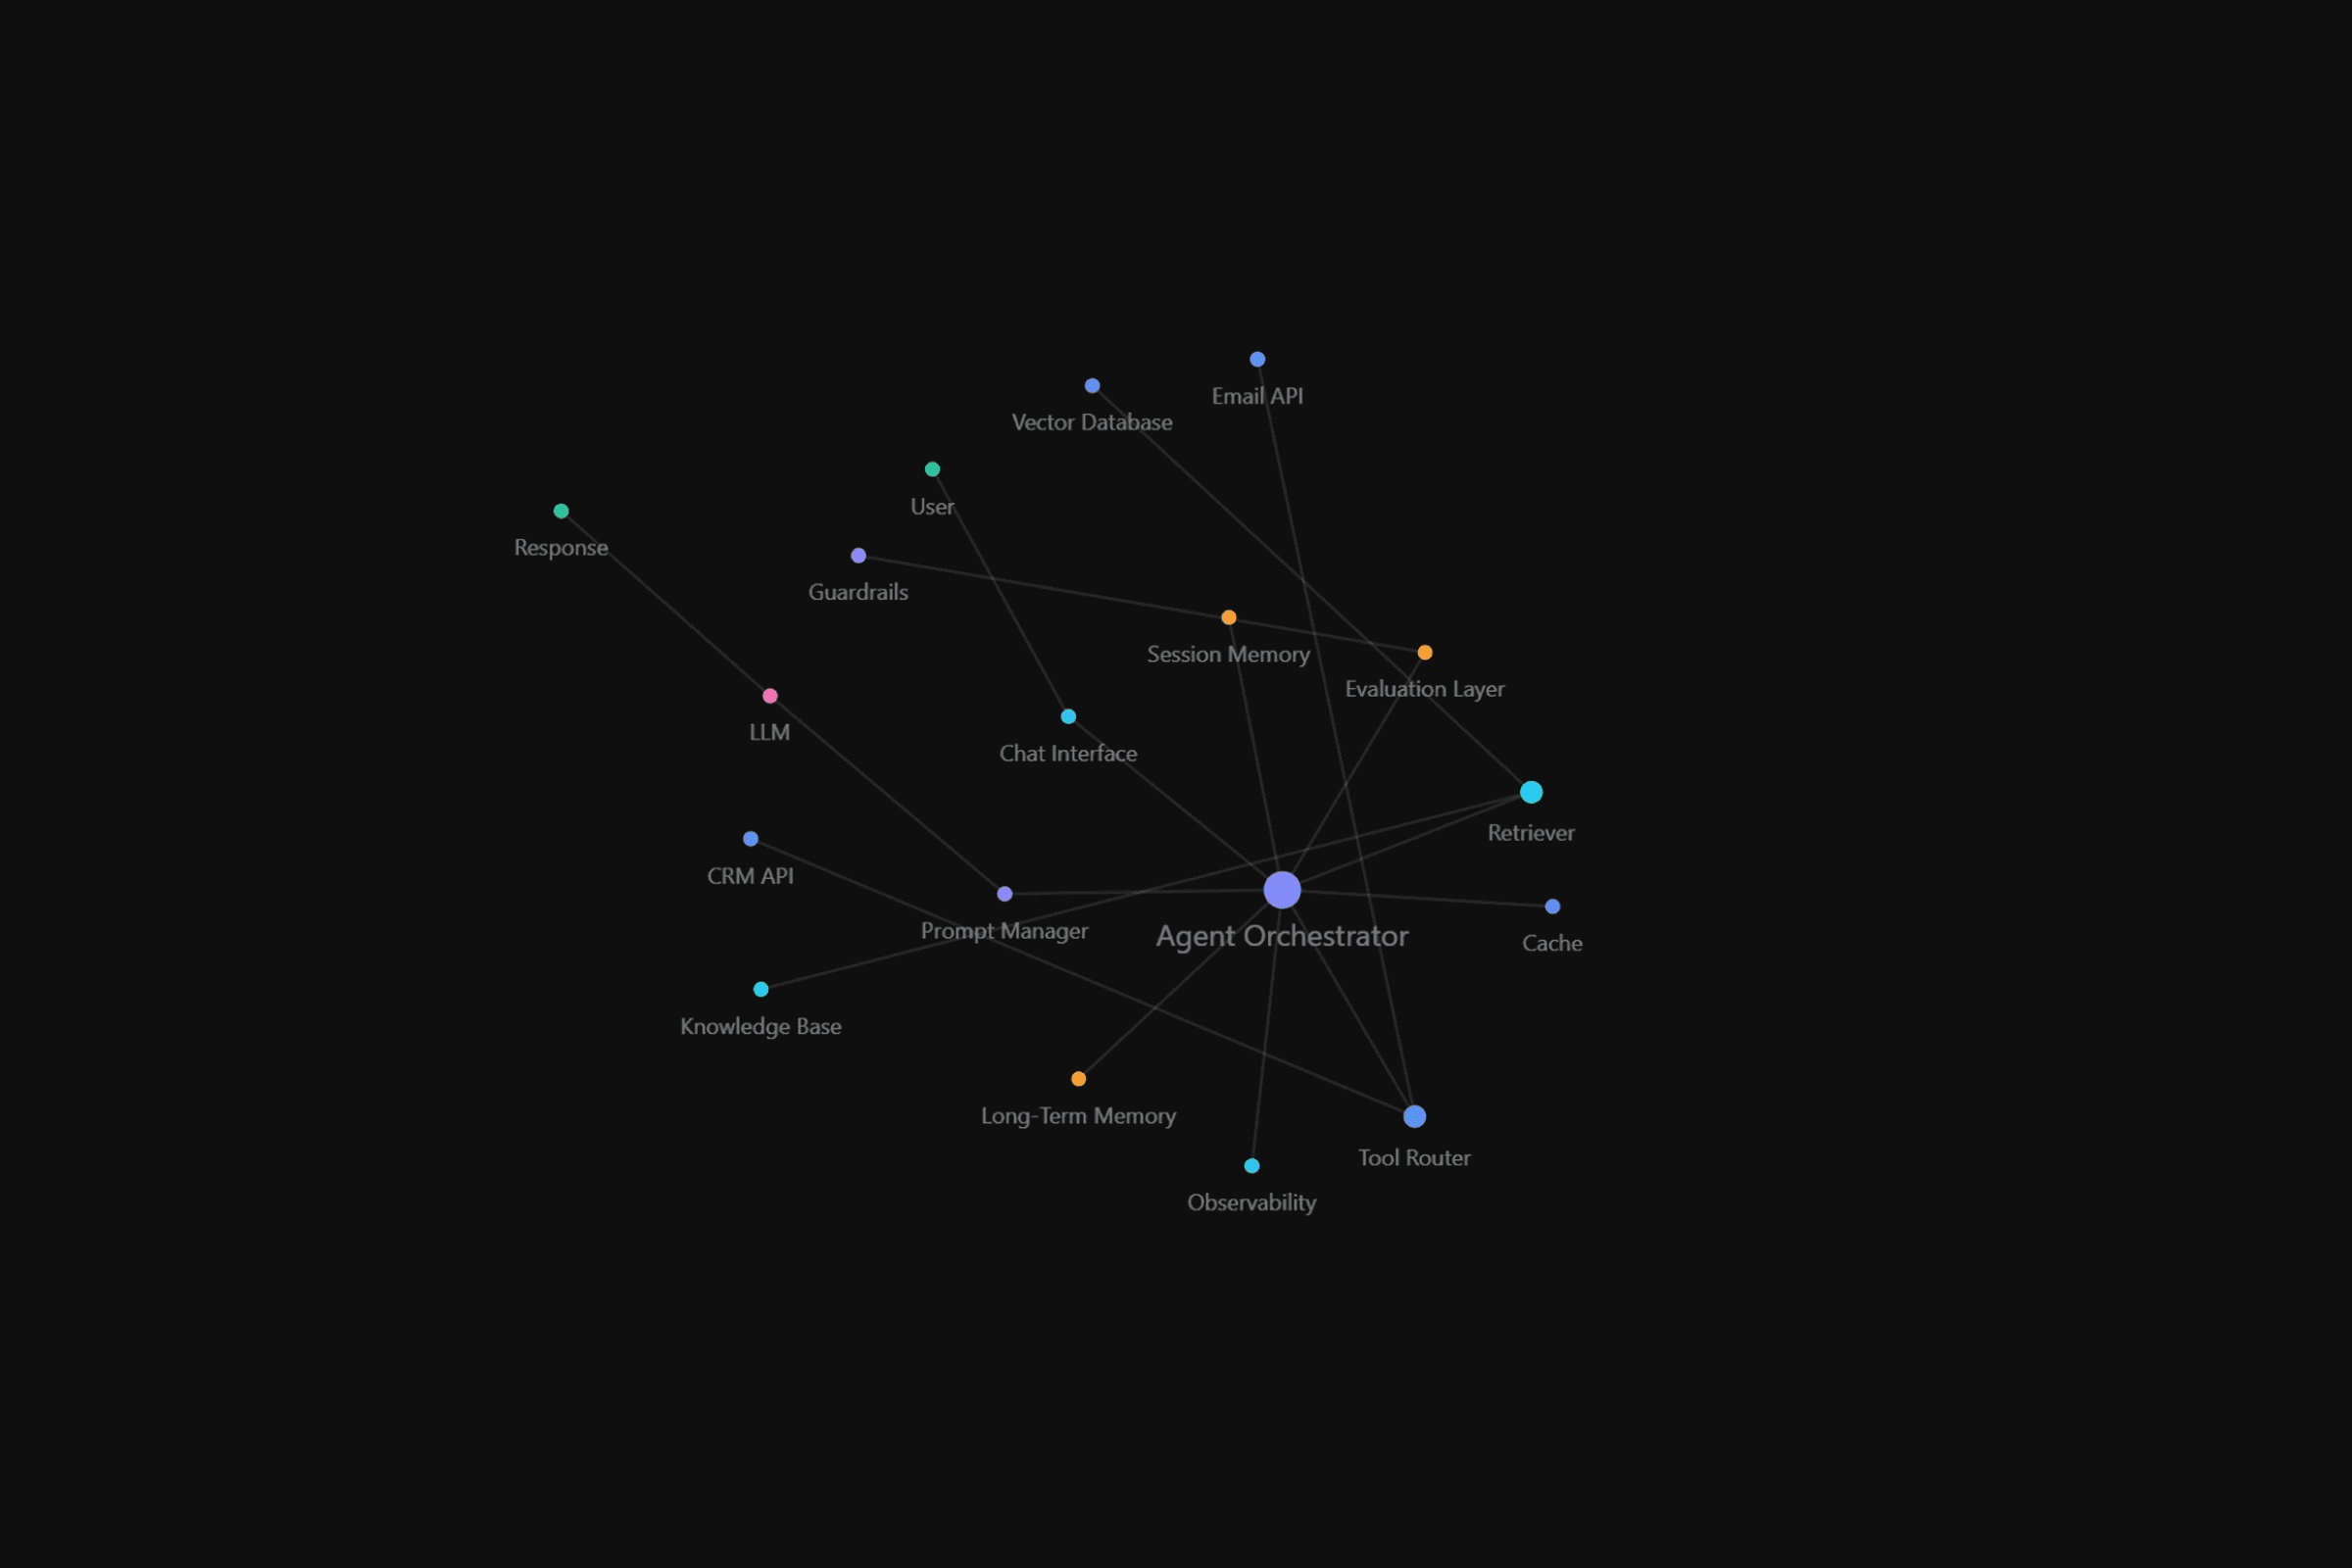
MokuGraph is an interactive force-directed graph component for Framer. It ships with 12 templates modelled on real AI architectures: agent orchestration, RAG pipelines, multi-agent teams, and MCP systems. Each template reflects how these systems are actually built in production, not how they appear in slide decks.
Architecture diagrams have been a constant throughout my career in IT and product design. As UX Lead at Karia, a SaaS startup, mapping systems visually has always been part of how I communicate with engineering teams and stakeholders. In early 2026, as AI adoption accelerated across the industry, that demand intensified. Every new agent workflow, every RAG integration, every MCP connection needed a diagram. Static slides could not keep pace with the conversations happening around these systems.
That gap, and the absence of anything like it on the Framer Marketplace, was the starting point for MokuGraph.
Challenge
Market gap
The Framer Marketplace had one existing knowledge graph component, but it was built for simple node-and-edge relationships. It could not represent the kind of multi-layered architectures that AI teams work with daily. There was nothing that could map an 18-node agent orchestration system and make it interactive and explorable.
Technical constraints
Building a physics-driven graph inside Framer's code component environment introduced specific constraints. D3's force simulation had to run performantly within Framer's rendering pipeline. Responsive behaviour needed to work across desktop, tablet, and mobile without configuration. Every visual property had to be exposed through the Framer property panel so buyers could customise without opening code.
First submission
The first version was submitted to the Framer Marketplace in May 2026 and rejected. The review cited all four evaluation criteria as unmet: Requirements, Functionality, Customizability, and Originality.
No detailed feedback accompanied the four labels. It was clear that incremental fixes would not be enough. The product needed a complete rethink.
Approach
Repositioning
The rejection forced a hard look at what the product actually was. The original submission was positioned as a generic knowledge graph, which put it in direct competition with the existing marketplace component. The differentiation was not clear enough.
The repositioning was direct. MokuGraph would become an AI Architecture Maps component. Not a general-purpose graph tool, but a specialised visualisation for the systems that AI teams were actually building. The tagline shifted from describing a technology to describing a use case: "AI Architecture Maps for Framer."
This narrower positioning also sharpened every subsequent design decision. Template selection, property controls, and even the default colour mode were all filtered through a single question: does this help someone map and communicate a real AI system?
Technical rebuild
The technical issues from the rejection were addressed systematically.
The D3 dependency was moved from a CDN import to a bundled npm package, eliminating runtime network requests and removing the misleading "zero dependencies" claim from the original listing. A personal Gist URL used as default data was removed entirely.
Simulation performance was tuned. Alpha decay went from 0.001 to 0.02, reducing the tick count from approximately 6,000 to 300. The result was a noticeably faster settle when the graph first loads or when a user drags a node.
The property panel was rebuilt from minimal controls to full customisation: colour mode (Vivid or Uniform), link distance, charge strength, connection strength, node size scale, show/hide labels, drawer width, drawer side, font family, and font weight. The intent was that buyers should be able to reshape the component entirely from the property panel, without needing to touch the source code.
Template architecture
The template library grew from a single built-in dataset to 12 architectures, organised into four tiers by complexity.
Tier 1 hero templates include AI Agent Architecture (18 nodes), Multi-Agent Team (12 nodes), and RAG Pipeline (10 nodes). These were modelled on real production systems rather than simplified textbook diagrams, designed to be immediately recognisable to anyone working in the AI infrastructure space.
Tiers 2 through 4 cover progressively more focused use cases: customer support agents, sales copilots, MCP architecture, memory systems, research workflows, coding assistants, and general-purpose graph structures.
A Custom JSON property was added so buyers could paste their own architecture data directly into the property panel. An Instructions component shipped alongside MokuGraph with copyable JSON for every template, giving buyers a realistic starting point rather than a blank canvas.
Interaction design
Two interaction modes address different use cases.
Ambient mode runs the force simulation with hover highlighting but no drawer. This suits hero sections and animated backgrounds where the graph serves as a visual element rather than an information source.
Interactive mode adds a click-to-open detail drawer showing title, description, category tags, and related nodes. Each related node is clickable, turning the drawer into a navigation tool that lets users move through the architecture without returning to the graph. This pattern reduces the cognitive load of exploring complex systems by keeping the user focused on one node and its immediate connections at a time.
On desktop, the drawer slides in from the side with frosted-glass styling. On mobile, it becomes a bottom sheet. The transition between these layouts is handled by breakpoint detection within the component itself, so no additional responsive configuration is needed from the buyer.
Outcome
Marketplace approval
MokuGraph was resubmitted to the Framer Marketplace on June 2, 2026, four weeks after the initial rejection, and approved.
The product that went back was fundamentally different. Templates grew from one to twelve. Property controls went from five to over thirty. D3 was bundled rather than loaded from a CDN. The market position shifted from a generic graph tool to the only AI architecture visualisation component on the platform.
What the rejection taught
The rebuild showed that a marketplace rejection, even without detailed feedback, can be a productive constraint. Every decision in the second submission was sharper because the first attempt had been measured against real standards and found lacking. The tier structure for templates, the physics tuning, and the custom JSON input all came from asking what the first version had failed to deliver.
In production
MokuGraph is already running on the Mokujiro Studio website. The homepage hero section uses the component in interactive mode: a graph maps the studio's disciplines and capabilities, and visitors can click through nodes and drawers to explore them. This demonstrates both intended use cases in a single deployment. The graph works as a visual element that adds depth to the landing page, and it works as a navigational tool that surfaces structured content through interaction.
What comes next
MokuGraph is planned as the foundation for MokuPhoto's architecture visualisation in a future release. The decision to build it as a template-driven, JSON-configurable system rather than a single-purpose tool means it can be applied to new contexts without rebuilding the core component.
MokuGraph
Shipped the only AI architecture visualisation component on the Framer Marketplace
Field | Detail |
|---|---|
Product | MokuGraph |
Type | Framer Marketplace Component |
Scope | Product design, D3 engineering, interaction design, marketplace listing, repositioning |
Platform | Framer |
Framework | React + TypeScript + D3 (bundled) |
Marketplace |
Summary
Problem: No interactive AI architecture visualisation existed on the Framer Marketplace. The one available graph component was general-purpose and could not represent the complexity of real production systems.
Solution: MokuGraph, a force-directed graph component with 12 AI architecture templates, two interaction modes, and full property-panel customisation. Built with React, TypeScript, and D3.
Impact: Rejected on first submission across all four Framer Marketplace criteria. Rebuilt from scratch, repositioned from generic graph tool to AI Architecture Maps, and approved four weeks later. Now in production on the Mokujiro Studio website.
Overview
MokuGraph is an interactive force-directed graph component for Framer. It ships with 12 templates modelled on real AI architectures: agent orchestration, RAG pipelines, multi-agent teams, and MCP systems. Each template reflects how these systems are actually built in production, not how they appear in slide decks.
Architecture diagrams have been a constant throughout my career in IT and product design. As UX Lead at Karia, a SaaS startup, mapping systems visually has always been part of how I communicate with engineering teams and stakeholders. In early 2026, as AI adoption accelerated across the industry, that demand intensified. Every new agent workflow, every RAG integration, every MCP connection needed a diagram. Static slides could not keep pace with the conversations happening around these systems.
That gap, and the absence of anything like it on the Framer Marketplace, was the starting point for MokuGraph.
Challenge
Market gap
The Framer Marketplace had one existing knowledge graph component, but it was built for simple node-and-edge relationships. It could not represent the kind of multi-layered architectures that AI teams work with daily. There was nothing that could map an 18-node agent orchestration system and make it interactive and explorable.
Technical constraints
Building a physics-driven graph inside Framer's code component environment introduced specific constraints. D3's force simulation had to run performantly within Framer's rendering pipeline. Responsive behaviour needed to work across desktop, tablet, and mobile without configuration. Every visual property had to be exposed through the Framer property panel so buyers could customise without opening code.
First submission
The first version was submitted to the Framer Marketplace in May 2026 and rejected. The review cited all four evaluation criteria as unmet: Requirements, Functionality, Customizability, and Originality.
No detailed feedback accompanied the four labels. It was clear that incremental fixes would not be enough. The product needed a complete rethink.
Approach
Repositioning
The rejection forced a hard look at what the product actually was. The original submission was positioned as a generic knowledge graph, which put it in direct competition with the existing marketplace component. The differentiation was not clear enough.
The repositioning was direct. MokuGraph would become an AI Architecture Maps component. Not a general-purpose graph tool, but a specialised visualisation for the systems that AI teams were actually building. The tagline shifted from describing a technology to describing a use case: "AI Architecture Maps for Framer."
This narrower positioning also sharpened every subsequent design decision. Template selection, property controls, and even the default colour mode were all filtered through a single question: does this help someone map and communicate a real AI system?
Technical rebuild
The technical issues from the rejection were addressed systematically.
The D3 dependency was moved from a CDN import to a bundled npm package, eliminating runtime network requests and removing the misleading "zero dependencies" claim from the original listing. A personal Gist URL used as default data was removed entirely.
Simulation performance was tuned. Alpha decay went from 0.001 to 0.02, reducing the tick count from approximately 6,000 to 300. The result was a noticeably faster settle when the graph first loads or when a user drags a node.
The property panel was rebuilt from minimal controls to full customisation: colour mode (Vivid or Uniform), link distance, charge strength, connection strength, node size scale, show/hide labels, drawer width, drawer side, font family, and font weight. The intent was that buyers should be able to reshape the component entirely from the property panel, without needing to touch the source code.
Template architecture
The template library grew from a single built-in dataset to 12 architectures, organised into four tiers by complexity.
Tier 1 hero templates include AI Agent Architecture (18 nodes), Multi-Agent Team (12 nodes), and RAG Pipeline (10 nodes). These were modelled on real production systems rather than simplified textbook diagrams, designed to be immediately recognisable to anyone working in the AI infrastructure space.
Tiers 2 through 4 cover progressively more focused use cases: customer support agents, sales copilots, MCP architecture, memory systems, research workflows, coding assistants, and general-purpose graph structures.
A Custom JSON property was added so buyers could paste their own architecture data directly into the property panel. An Instructions component shipped alongside MokuGraph with copyable JSON for every template, giving buyers a realistic starting point rather than a blank canvas.
Interaction design
Two interaction modes address different use cases.
Ambient mode runs the force simulation with hover highlighting but no drawer. This suits hero sections and animated backgrounds where the graph serves as a visual element rather than an information source.
Interactive mode adds a click-to-open detail drawer showing title, description, category tags, and related nodes. Each related node is clickable, turning the drawer into a navigation tool that lets users move through the architecture without returning to the graph. This pattern reduces the cognitive load of exploring complex systems by keeping the user focused on one node and its immediate connections at a time.
On desktop, the drawer slides in from the side with frosted-glass styling. On mobile, it becomes a bottom sheet. The transition between these layouts is handled by breakpoint detection within the component itself, so no additional responsive configuration is needed from the buyer.
Outcome
Marketplace approval
MokuGraph was resubmitted to the Framer Marketplace on June 2, 2026, four weeks after the initial rejection, and approved.
The product that went back was fundamentally different. Templates grew from one to twelve. Property controls went from five to over thirty. D3 was bundled rather than loaded from a CDN. The market position shifted from a generic graph tool to the only AI architecture visualisation component on the platform.
What the rejection taught
The rebuild showed that a marketplace rejection, even without detailed feedback, can be a productive constraint. Every decision in the second submission was sharper because the first attempt had been measured against real standards and found lacking. The tier structure for templates, the physics tuning, and the custom JSON input all came from asking what the first version had failed to deliver.
In production
MokuGraph is already running on the Mokujiro Studio website. The homepage hero section uses the component in interactive mode: a graph maps the studio's disciplines and capabilities, and visitors can click through nodes and drawers to explore them. This demonstrates both intended use cases in a single deployment. The graph works as a visual element that adds depth to the landing page, and it works as a navigational tool that surfaces structured content through interaction.
What comes next
MokuGraph is planned as the foundation for MokuPhoto's architecture visualisation in a future release. The decision to build it as a template-driven, JSON-configurable system rather than a single-purpose tool means it can be applied to new contexts without rebuilding the core component.
Case study walkthroughs available upon request.
Case study walkthroughs available upon request.
© 2026 Mokujiro Studio
© 2026 Mokujiro Studio